Analytics tab
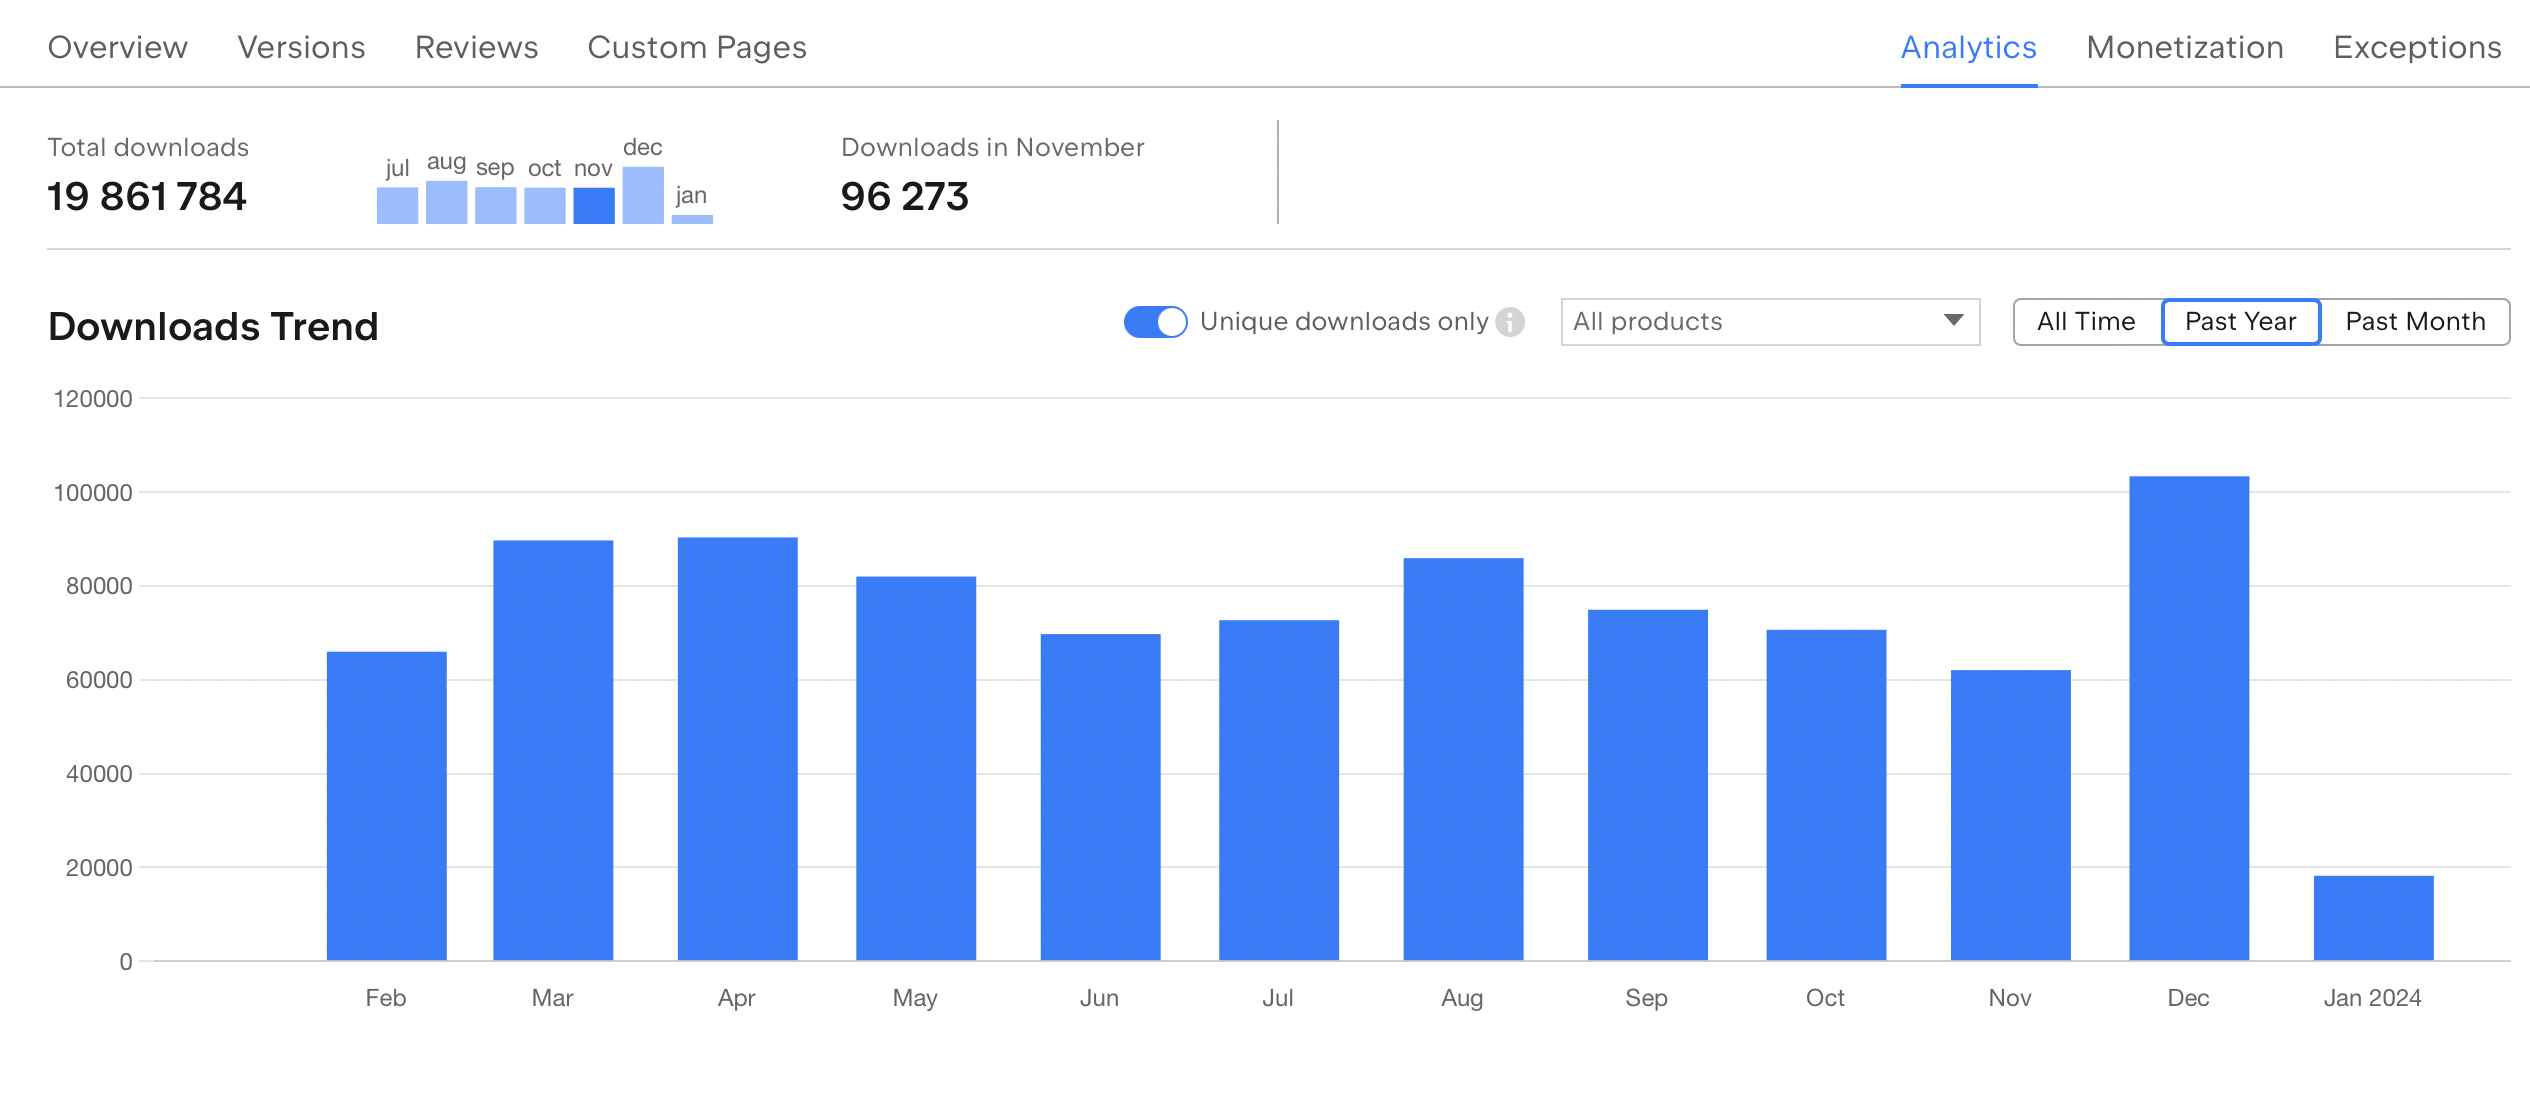
On the Analytics tab of the plugin page, you can see a dashboard with interactive charts, including download stats, sales graphs (for paid plugins), and some web analytics. Here are the statistics you can find on the dashboard:
Download summary
Total number of downloads and the dynamics of downloads by month.

The total number of downloads is also displayed in the plugin card preview and IDE search.
Sales summary
Overview of the business performance for paid plugins. See the total sales for the current month and daily dynamics.

Plugin Downloads
You can filter out downloads by the product or by period (all time, past year, past month). By default, we show unique download statistics.

The uniqueness is based on the unique user ID (UUID) which is bound to the computer OS. The UUID is shared among all IntelliJ-based IDEs on this computer and does not change during IDE updates. However, the UUID will be different if an IDE with one license is installed on various computers.
Downloads by product:
Here, we display downloads filtered out by a specific IDE throughout all time.

Total sales
Business performance for paid plugins. View the total sales amount in US Dollars generated by a paid plugin since its release. View the monthly sales dynamics for the last year or daily dynamics for the last month. To view the details about sales by country, proceed to the Sales tab.
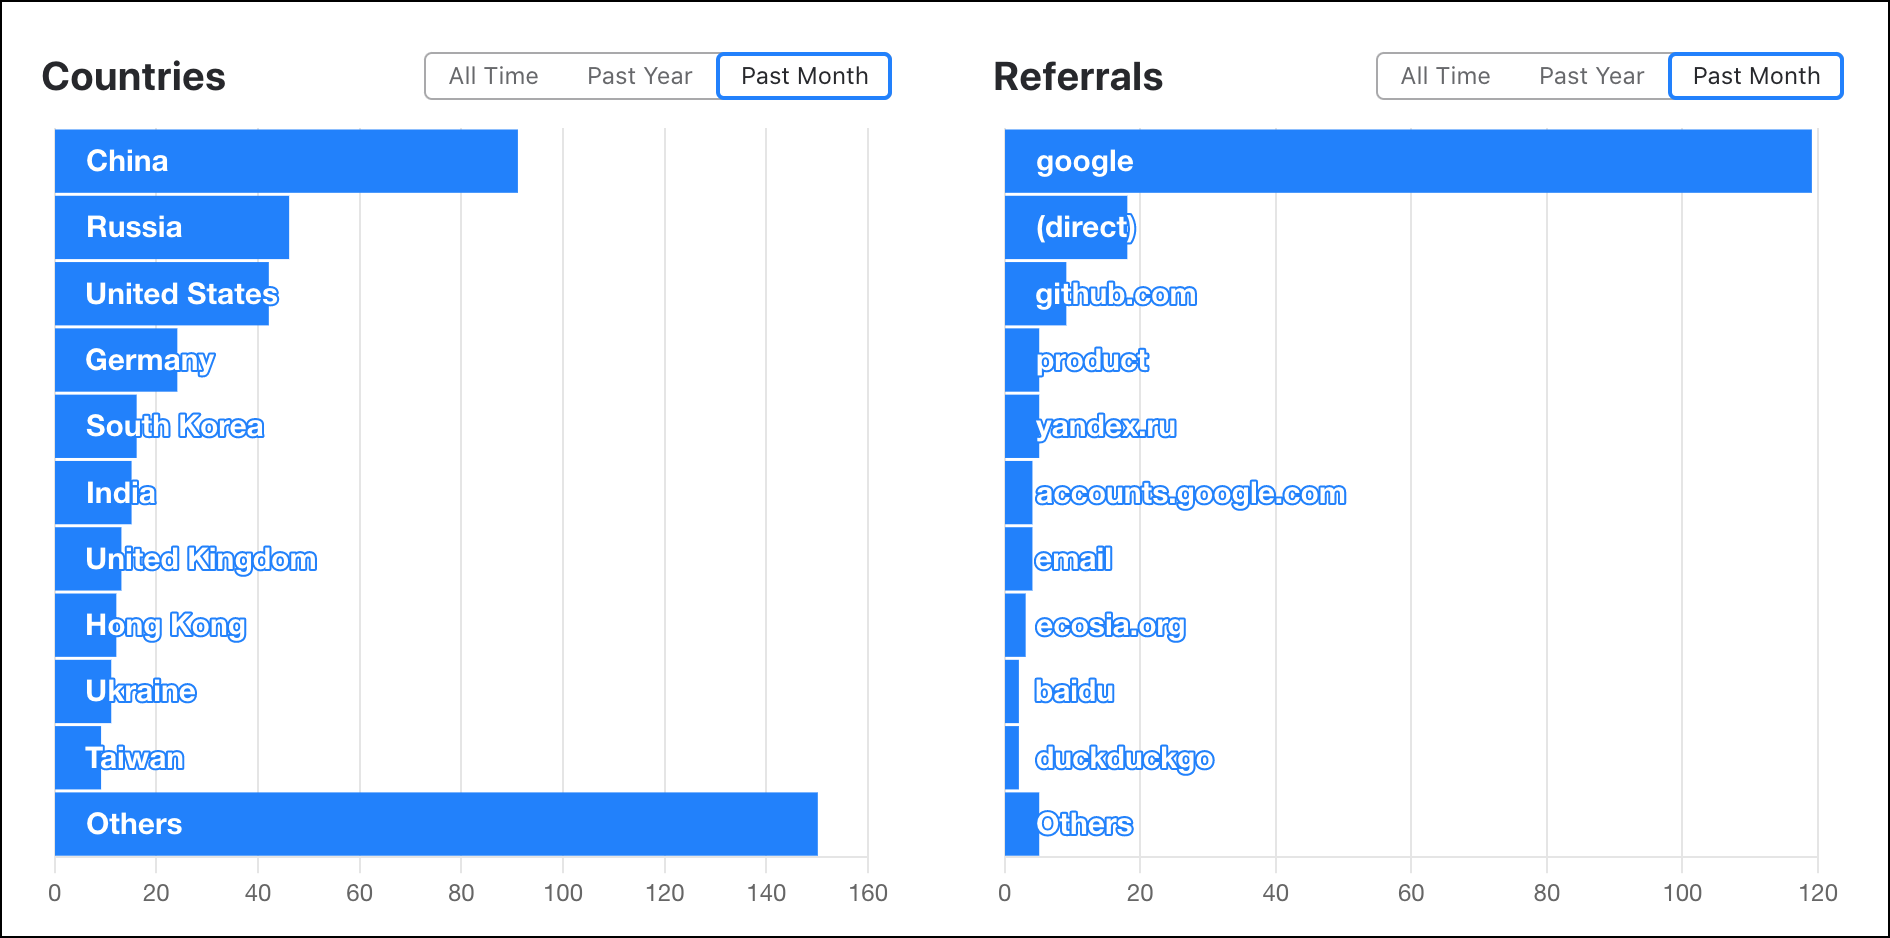
Plugin page visitors
Monthly unique page users. This can be viewed for different periods (all time, past year, past month) and displays the count and trend of plugin page users during the selected period.

Countries | Referrals |
|---|---|
Traffic to your plugin page broken down by country. | Sources of traffic leading to your plugin page (IDE, direct) and specific sites referring to your plugin page. |
