Error handler
Previously, plugin authors could only implement a custom error handler to receive exception and freeze reports from users.
However, we have the error handler now that collects uncaught exceptions and IDE freezes attributed to your plugin,and surfaces them on your plugin page under dedicated Exceptions and Freezes tabs.
How it works for end-users
Manual reporting
When an exception or freeze occurs in the IDE, the IDE Internal Errors dialog lets users:
Review technical details, including stack traces, thread dumps, and other attachments.
Give consent to share the report with the plugin author.
Select Report to third-party plugin to submit the report to JetBrains Marketplace.

Automatic reporting
If users have enabled Send error reports to JetBrains automatically, all error and freeze reports are sent automatically, without additional notifications or an error dialog.
How it works for vendors
The Error Handler adds two dedicated tabs to your plugin page on JetBrains Marketplace.
The Exceptions tab:
All received exception reports are grouped into Unresolved Issues and Resolved Issues.
For each exception you can see key metadata such as OS, IDE version, plugin version, and the full stack trace.
After investigating and fixing an issue, you can mark it as Resolved.

The Freezes tab
That provides a similar workflow but tailored to IDE freezes:
Reports are grouped by error type, with each top-level entry in the left sidebar representing a freeze group.
Each group can contain subgroups or collections of reports with similar stack traces, called piles.
Each pile displays a single representative report. Plugin authors see a list of these reports, while the Error Handler aggregates similar freezes into piles behind the scenes.
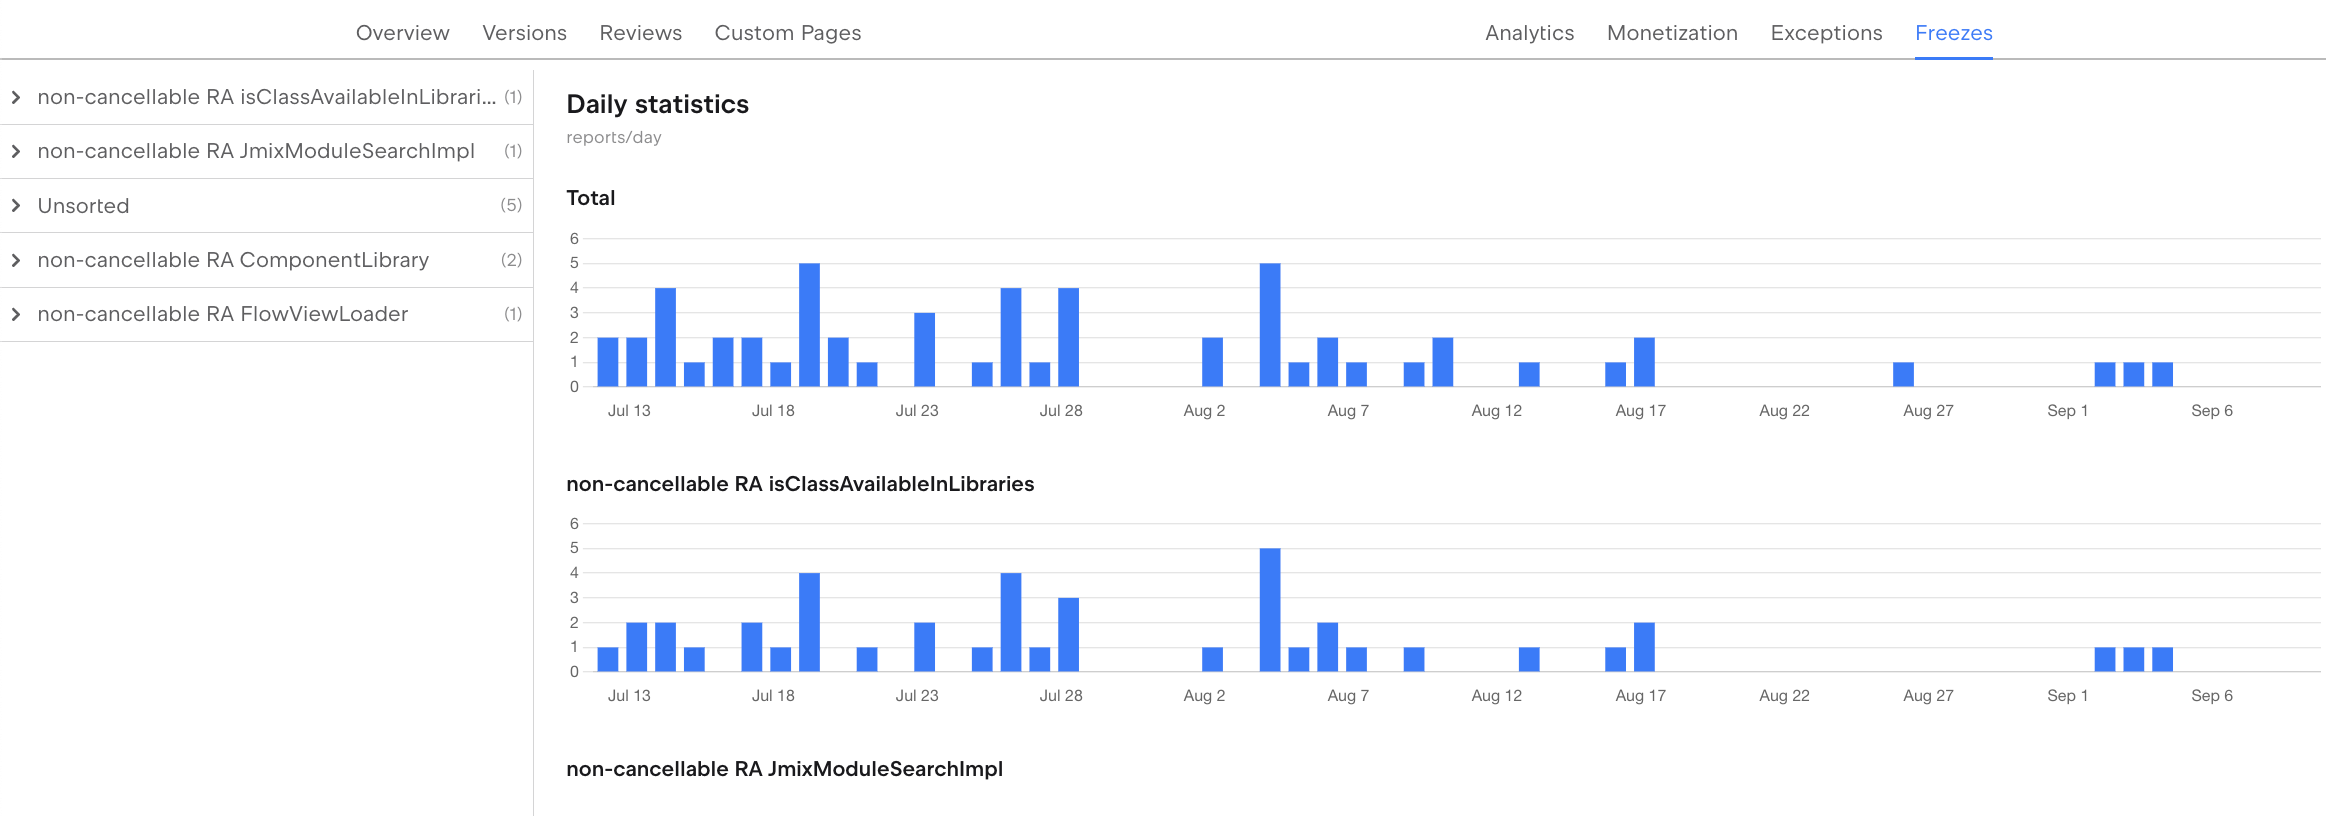
Each freeze report includes:
Thread dump excerpt: A short excerpt showing the threads involved in the freeze, as identified by automatic analysis.
dump-N.txt: Files containing full thread dumps captured every five seconds during the UI freeze.
Reports may also include the following optional attachments:
snapshot.jfr: A CPU snapshot, attached when the IDE can capture one.report.txt: An analysis of thread stacks based on the captured dumps.open-telemetry-metrics.csv: Performance metrics, including those related to the virtual file system (VFS) and UI responsiveness.
How to opt in?
To start getting exception reports from users, it is necessary to opt-in to this feature by adding the following entry that provides the JetBrains Marketplace error handler implementation to the plugin.xml file:
The JetBrainsMarketplaceErrorReportSubmitter helper class has been available since the 2023.3 release cycle.